top of page

INFOGRAPHICS
These diagrammatic illustrations are designed to communicate complex concepts, information, and ideas with clarity and precision. My approach focuses on distilling information into clean, intuitive visuals that enhance understanding while maintaining a strong sense of visual interest and design excellence.
Project type
Infographics

01
INFOGRAPHICS

01
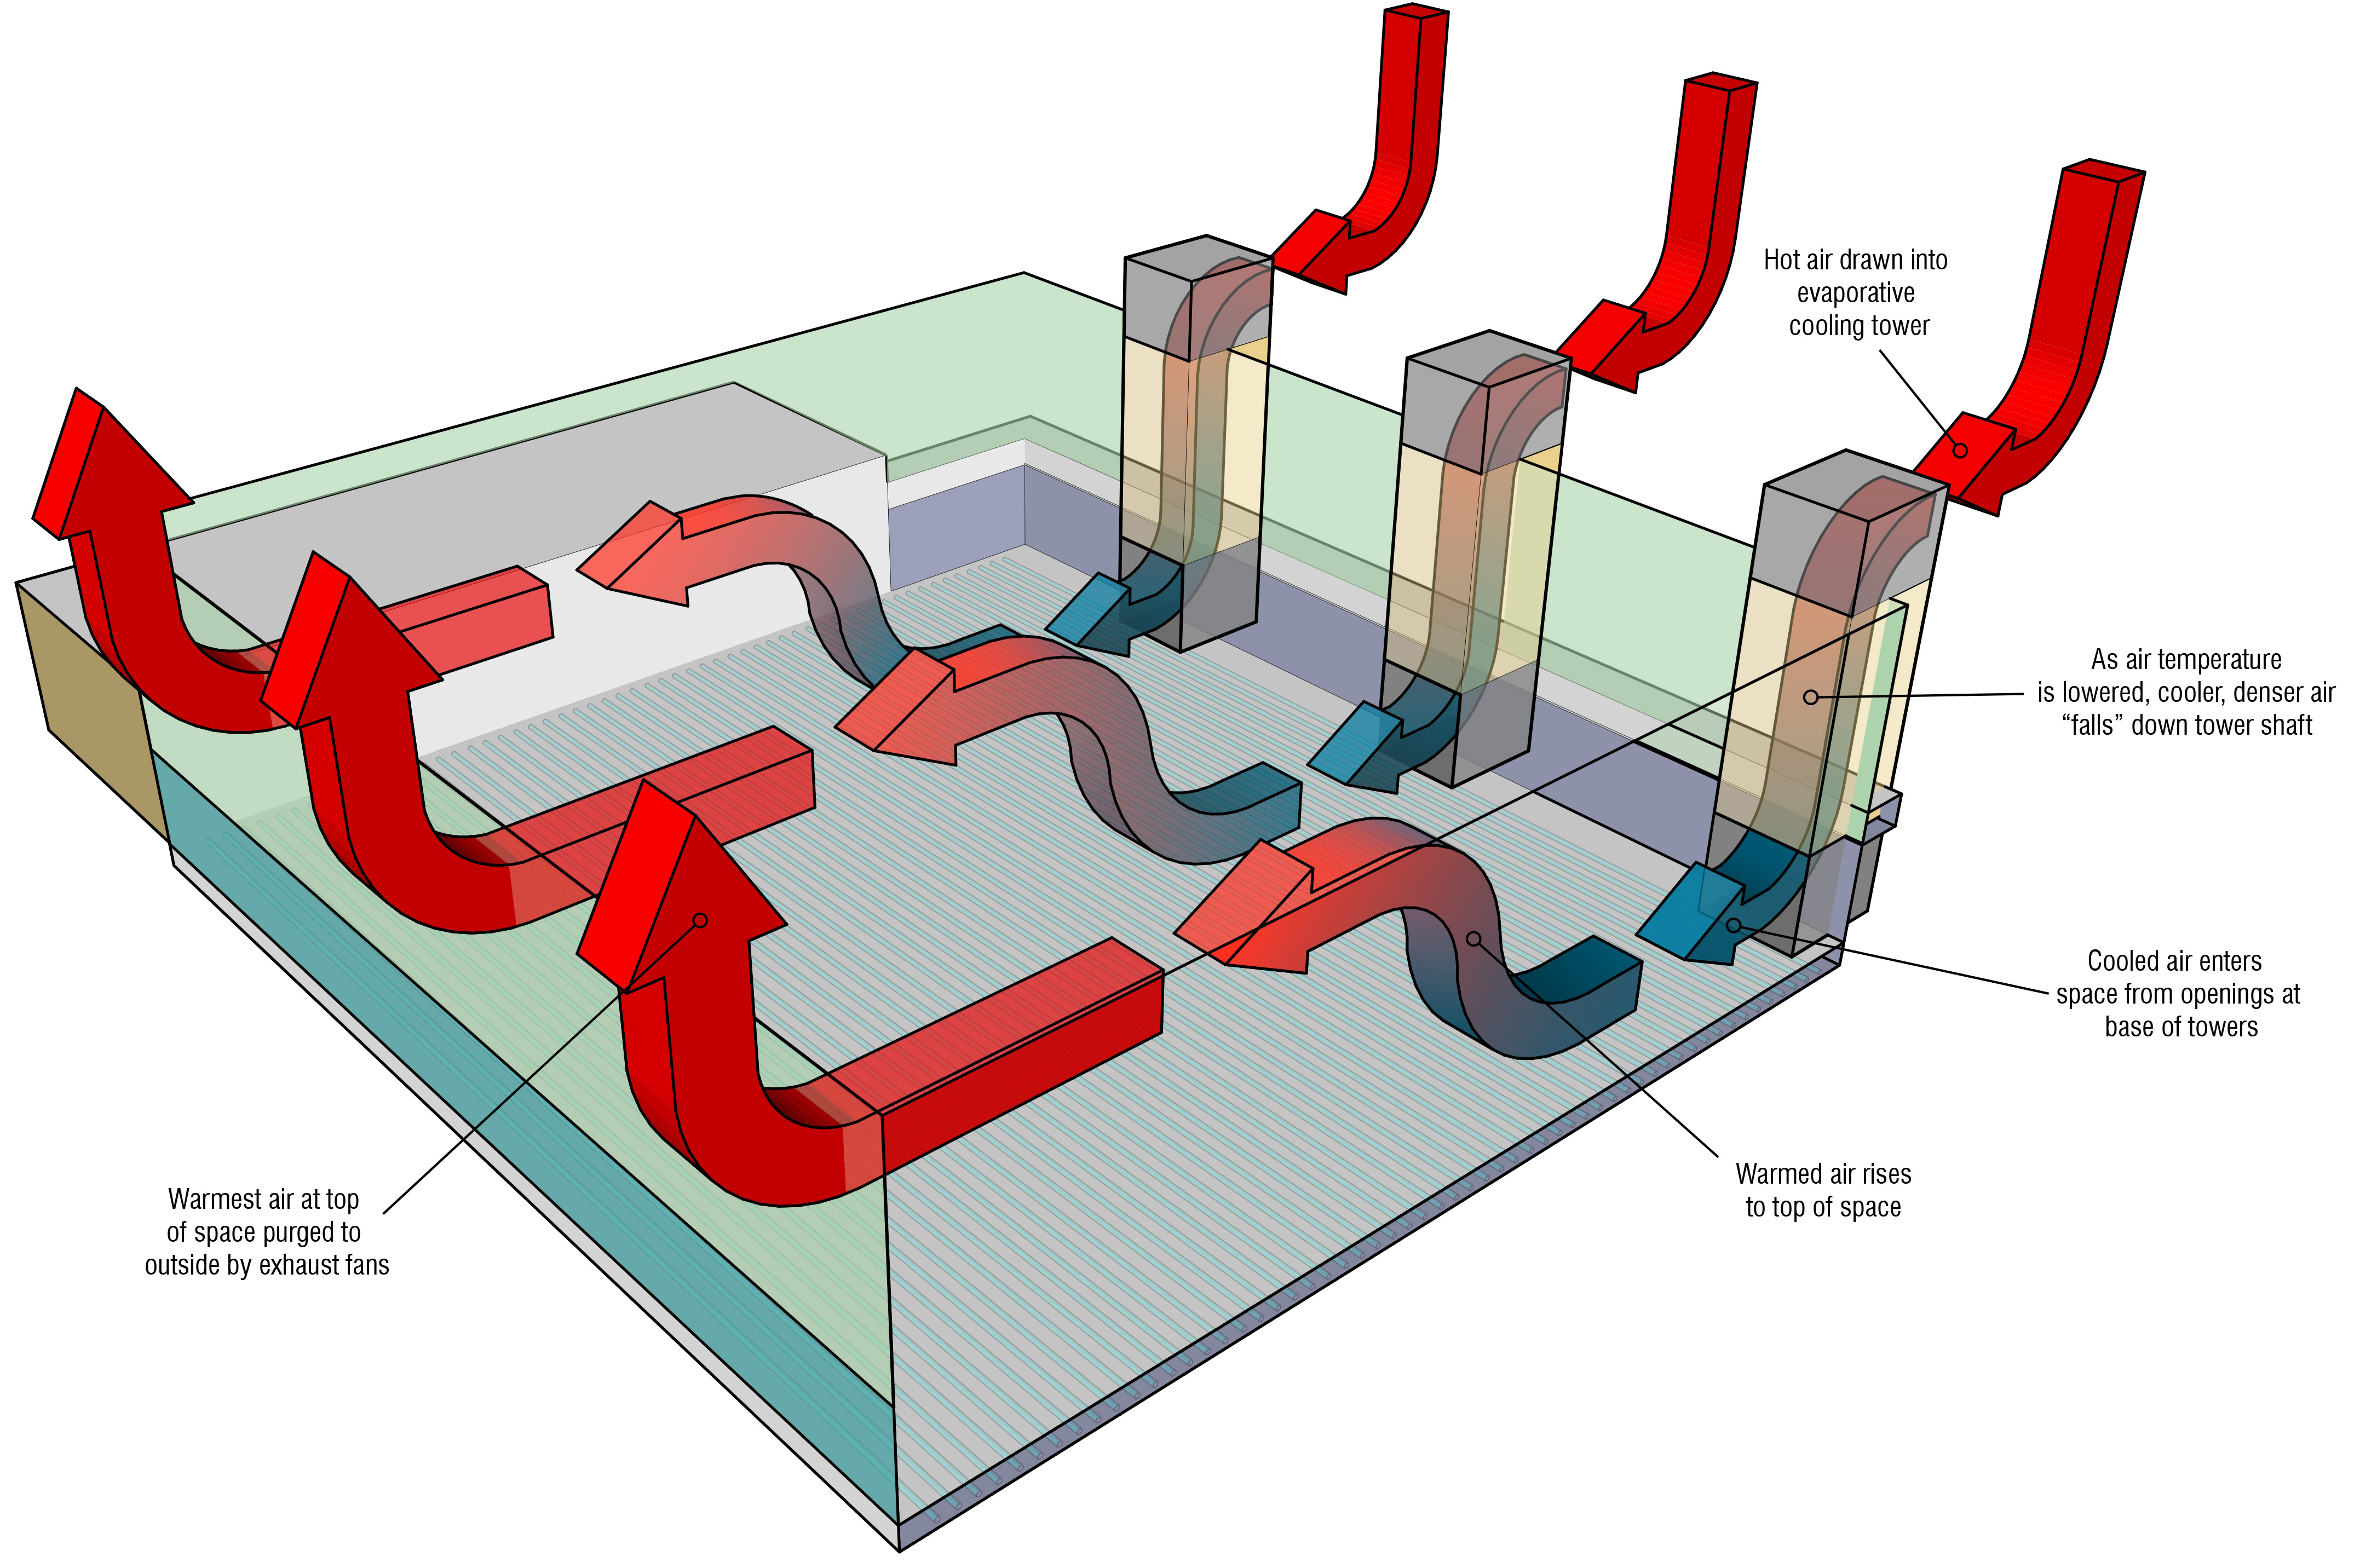
Cooling Towers
Diagram illustrating cooling tower technology. Hot air is drawn into a cooling tower then pulled into the lower portion of the space. As the air heats up over time, it rises and is pulled out of the space, a cycle which continuously provides cool air to large volumes.

02
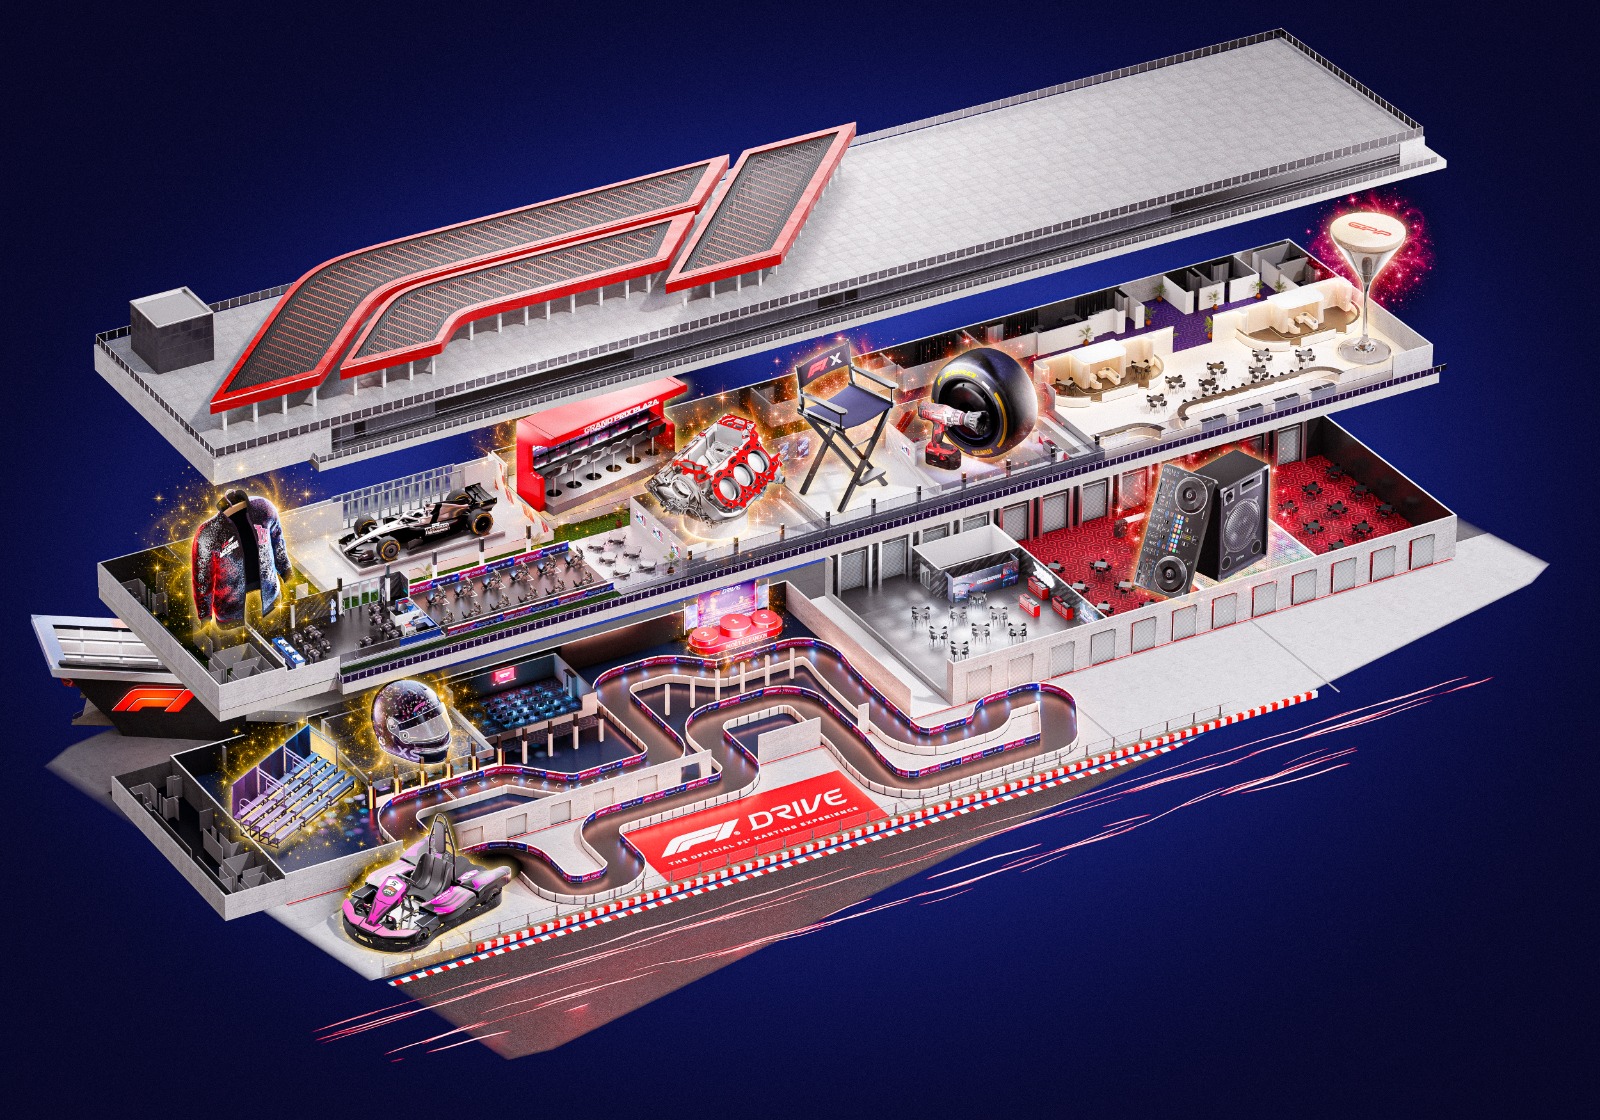
Grand Prix Plaza Diagrammatic Map
I provided creative direction to Richard Parry, a 3D artist, to create a dimensional map of the attractions at Grand Prix Plaza.

03
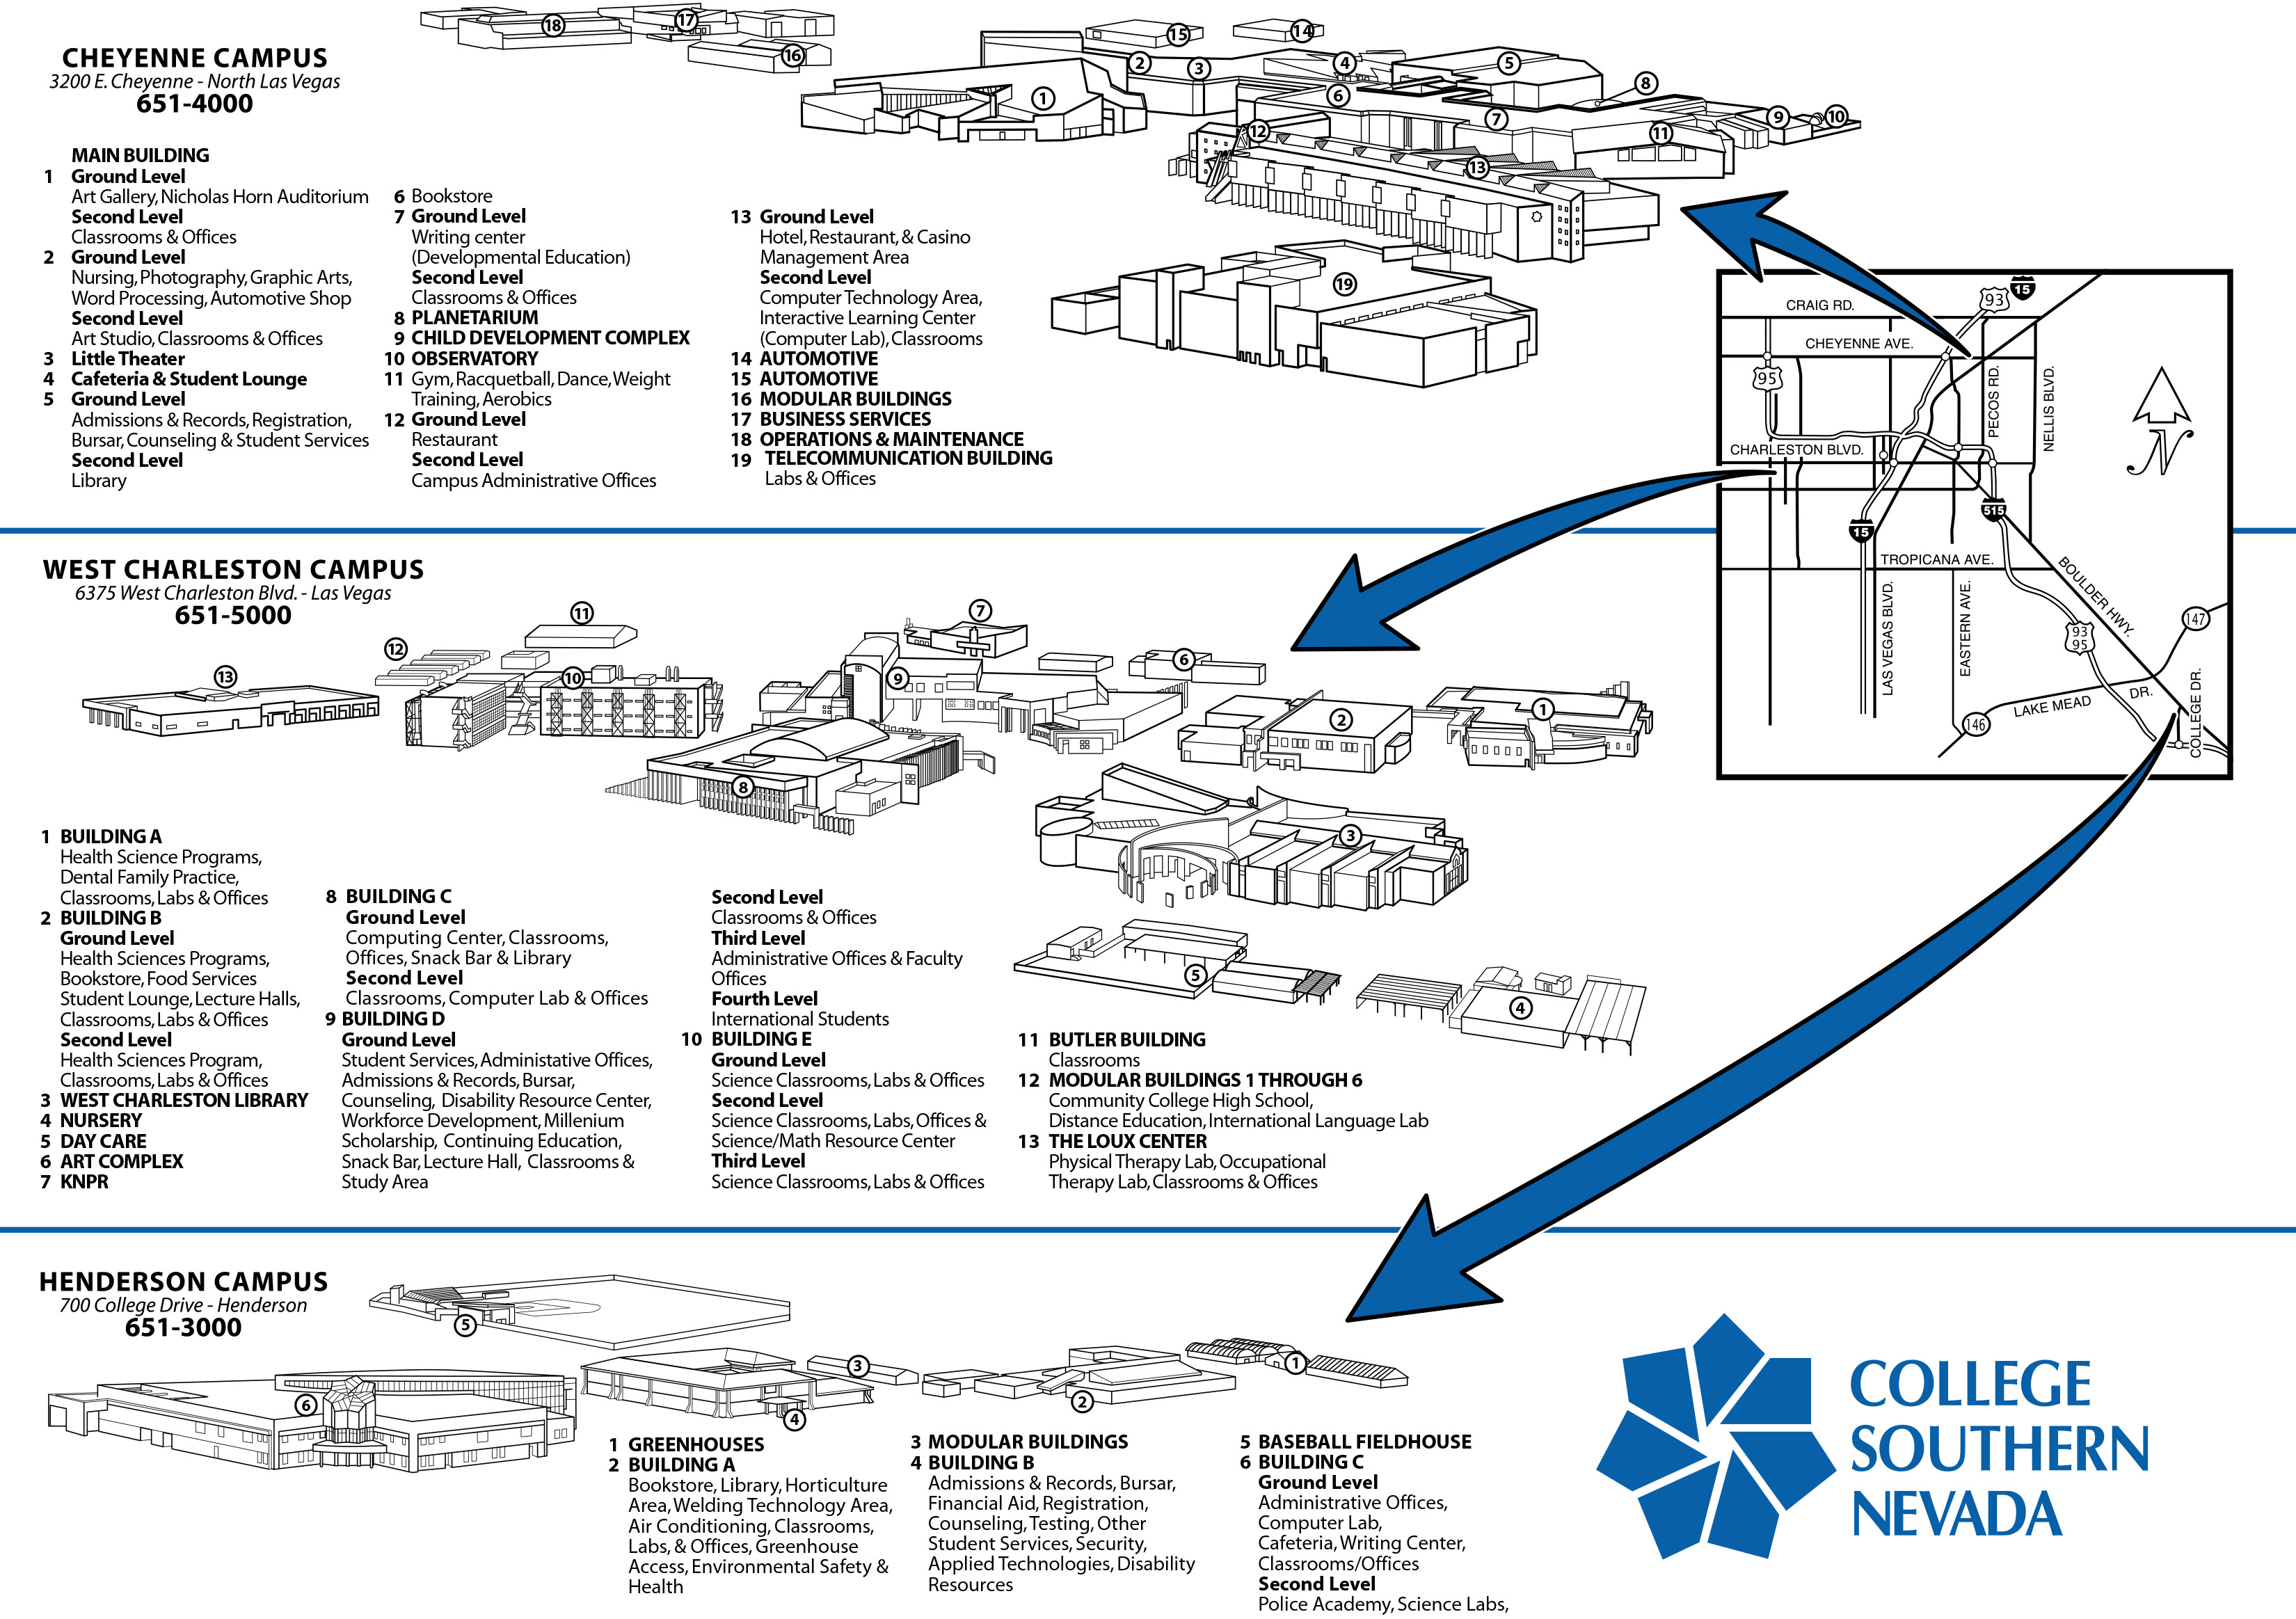
CSN Map
I illustrated the buildings of the various CSN campuses for use in this map for students and visitors.

04
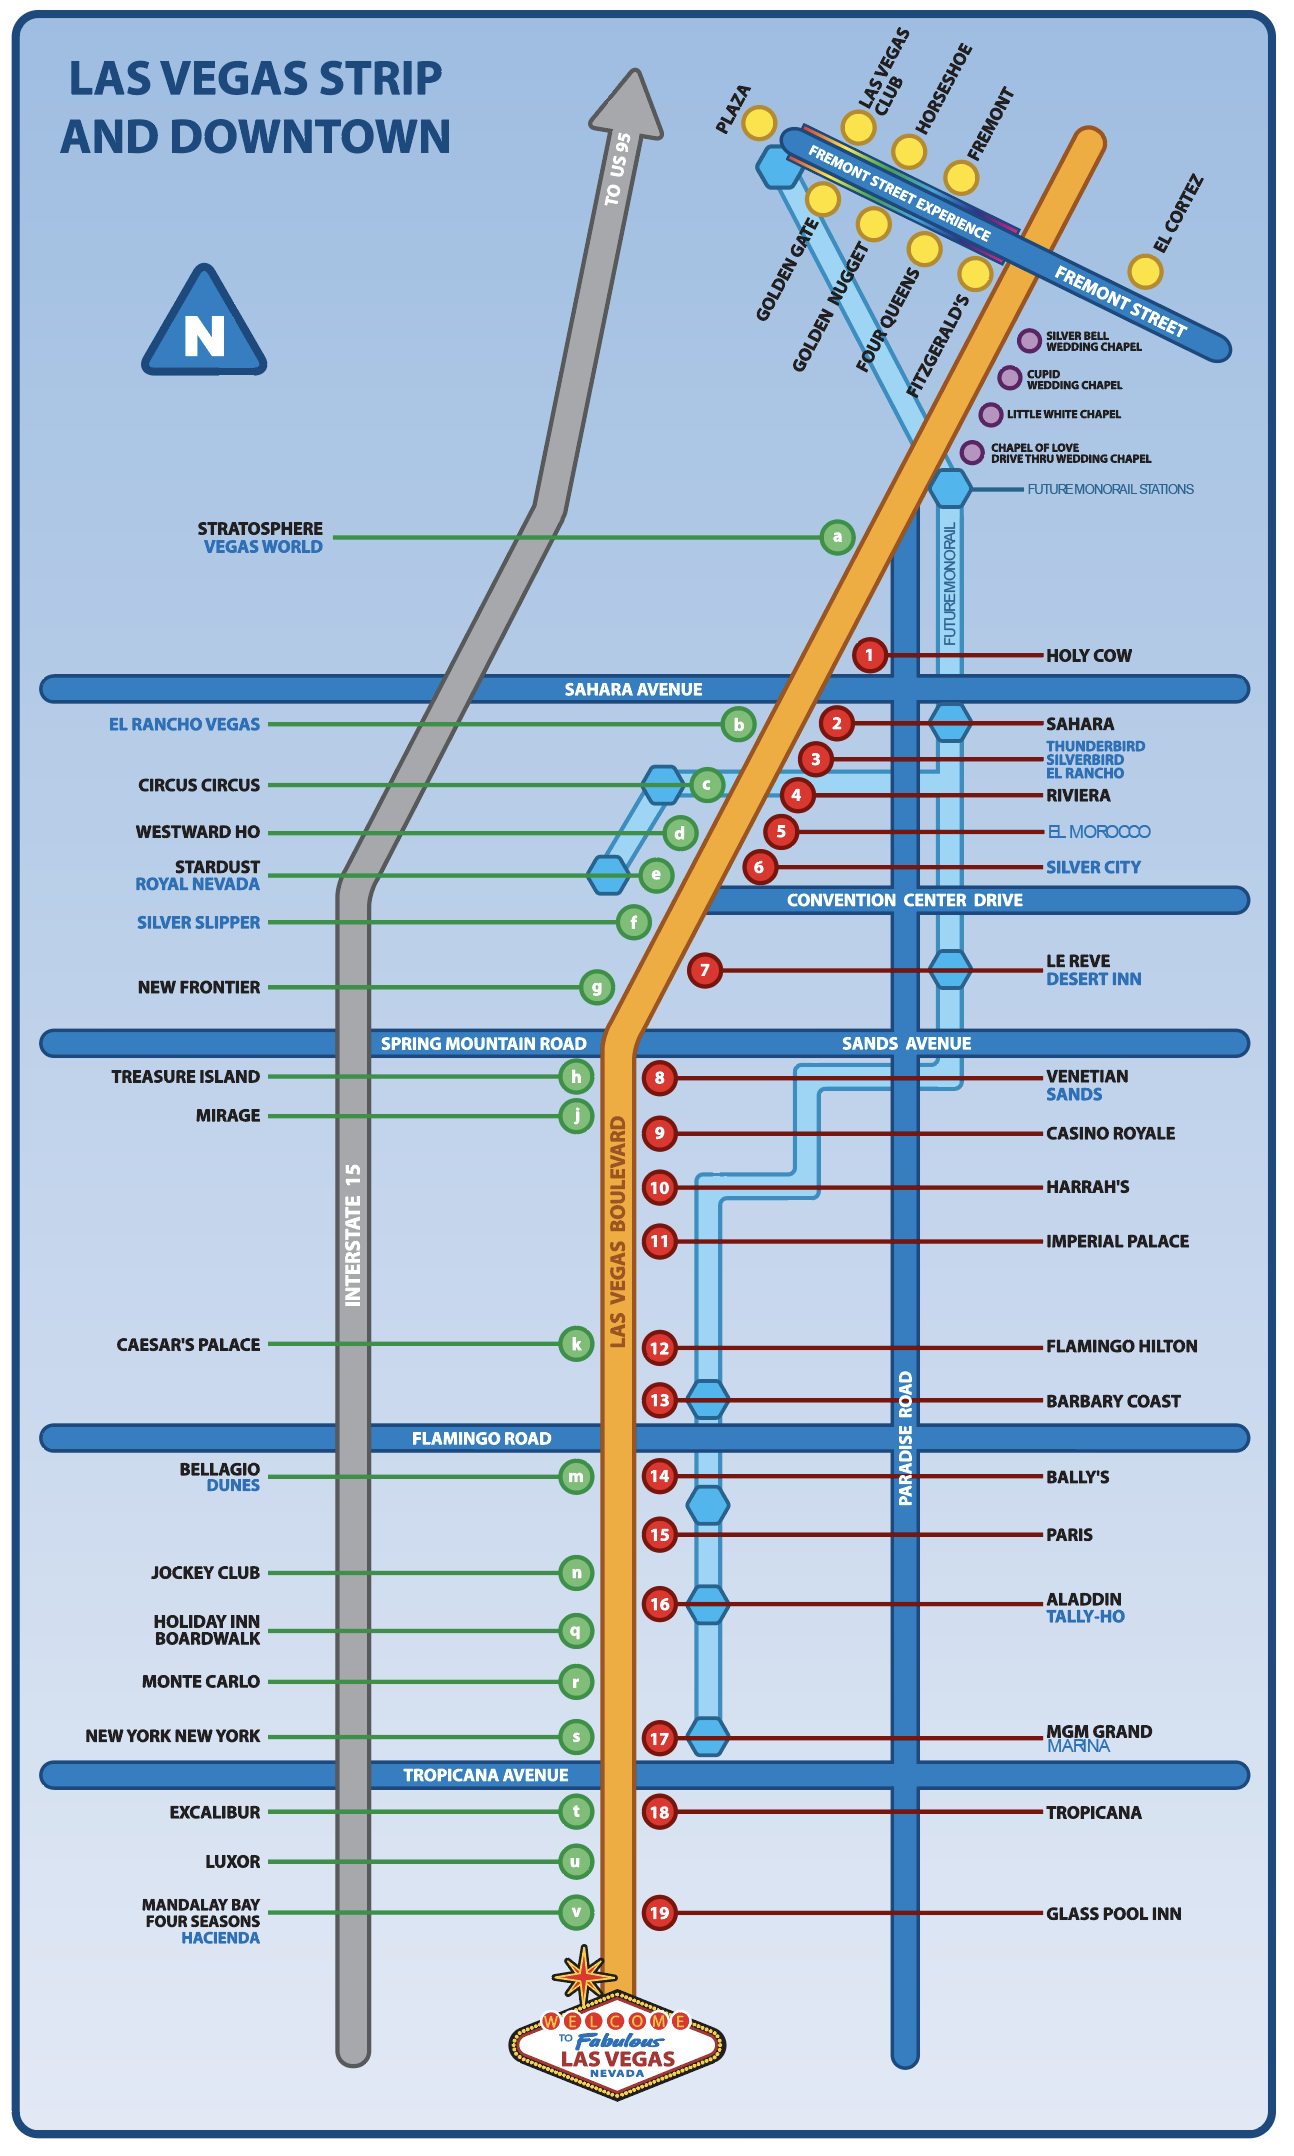
Strip Map
I created this map for a tour of the Las Vegas Strip, highlighting current properties and the legacy properties which were replaced.

05
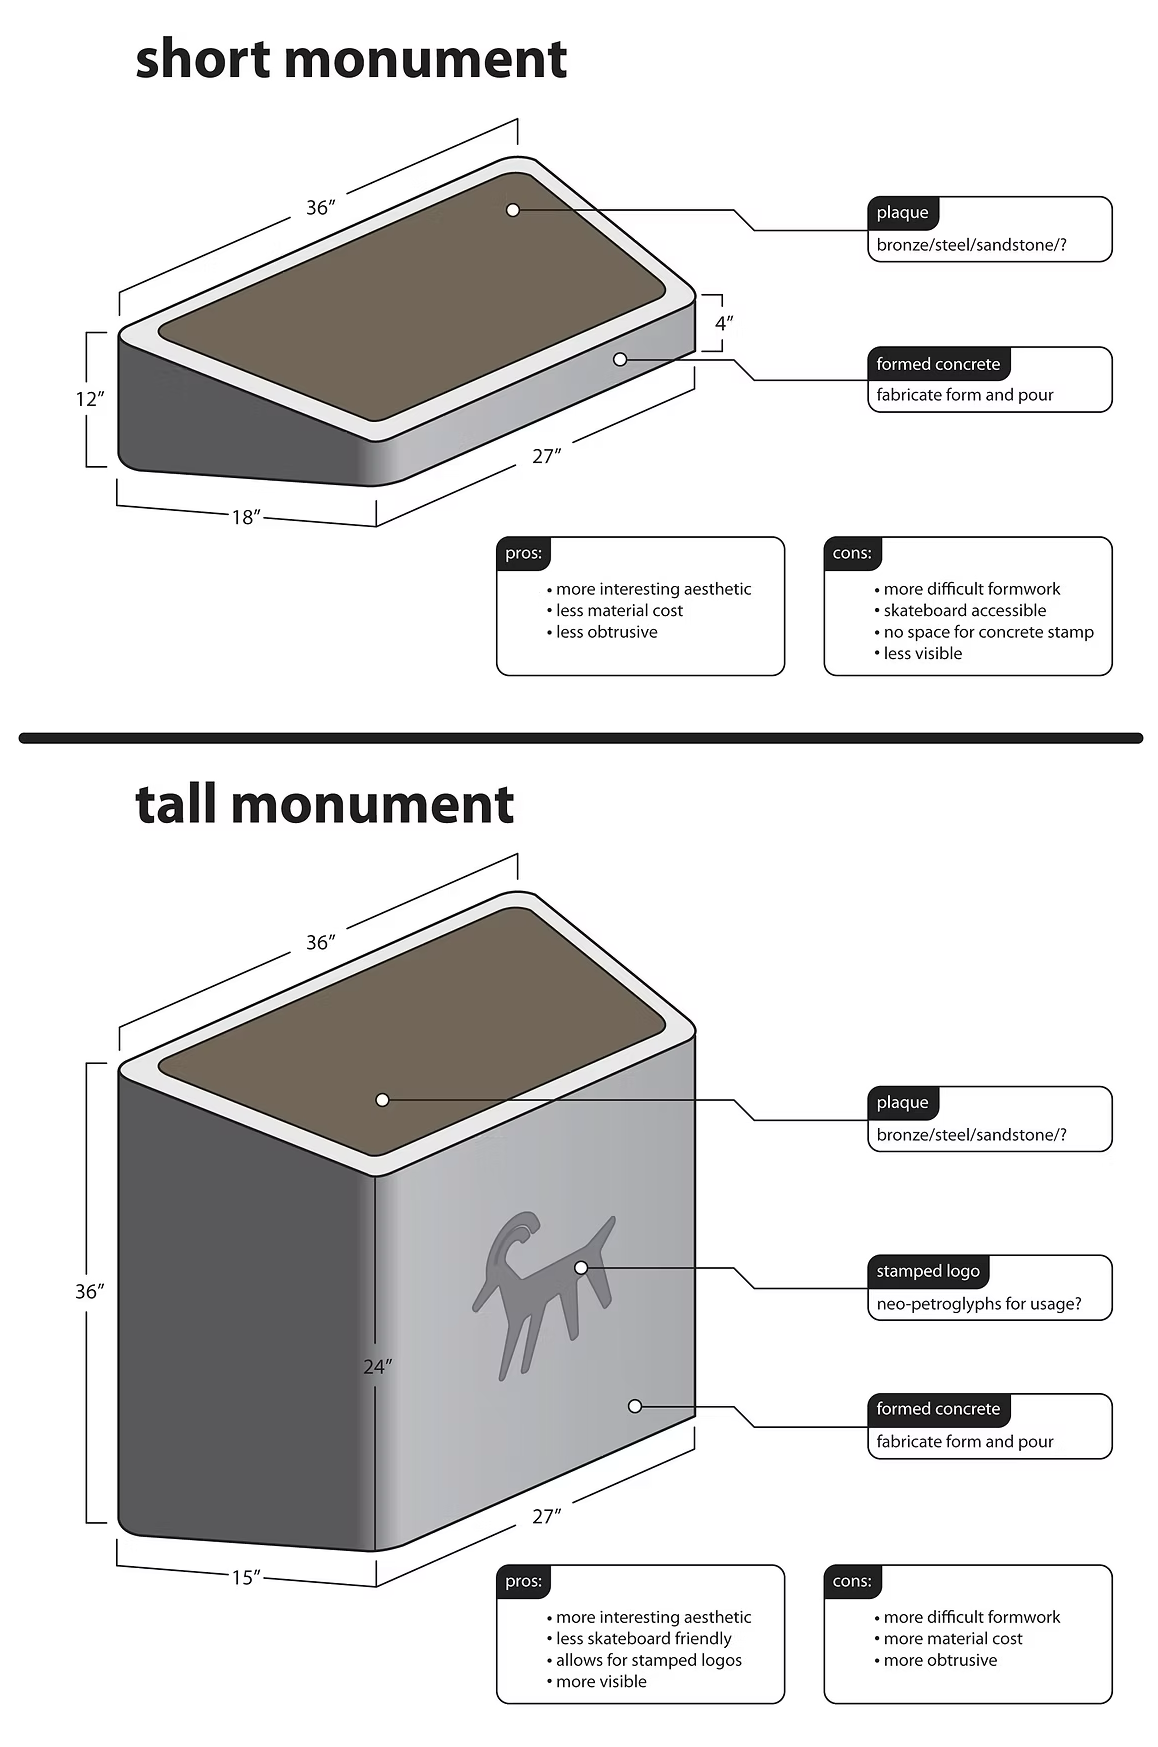
SNPLMA Monuments
I designed monuments to be placed at Public Works projects to recognize the fact that they were funded by the Southern Nevada Public Land Management Act. This diagram explained the design and offered options for their fabrication.
bottom of page